# 一、SpringBoot Actuator
# 1.1 简介
Actuator是springboot中的一个附加功能,官方是对它这样介绍的:
Spring Boot包括许多附加功能,可帮助您在将应用程序推向生产环境时监视和管理应用程序。您可以选择使用HTTP端点或JMX来管理和监视应用程序。审核、运行状况和指标收集也可以自动应用于您的应用程序。
Spring Boot Actuator可以帮助我们全方面监控应用节点,比如健康检查、审计、统计、HTTP追踪等。我们可以通过JMX或者HTTP endpoints来获得。
在Spring Boot应用中,要实现监控的功能,只需要依赖组件spring-boot-starter-actuator。
它提供了很多监控和管理你的Spring Boot应用的HTTP或者JMX端点,并且你可以有选择地开启和关闭部分功能。
当你的Spring Boot应用中引入依赖之后,将自动拥有审计、健康检查、Metrics监控功能。
# 二、Actuator配置项
# 2.1 endpoints
Actuator endpoints官网说明 (opens new window)
| Endpoint ID | Description |
|---|---|
| auditevent | 显示应用暴露的审计事件(比如认证进入、订单失败) |
| info | 显示应用的基本信息 |
| health | 显示应用的健康状态 |
| metrics | 显示应用多样的度量信息,例如jvm内存、cpu使用、jvm线程等。 |
| loggers | 显示和修改配置的loggers |
| logfile | 返回log file中的内容(如果logging.file或者logging.path被设置) |
| httptrace | 显示HTTP足迹,最近100个HTTP request/reponse |
| env | 显示当前的环境特性 |
| flyway | 显示数据库迁移路径的详细信息 |
| shutdown | 优雅地逐步关闭应用 |
| mappings | 显示所有的@RequestMapping路径 |
| scheduledtasks | 显示应用中的调度任务 |
| threaddump | 执行一个线程dump |
| heapdump | 返回一个GZip压缩的JVM堆dump |
# 1、metrics
metrics endpoint展示了你可以追踪的度量,例如jvm内存、cpu使用、jvm线程等。如下所示:
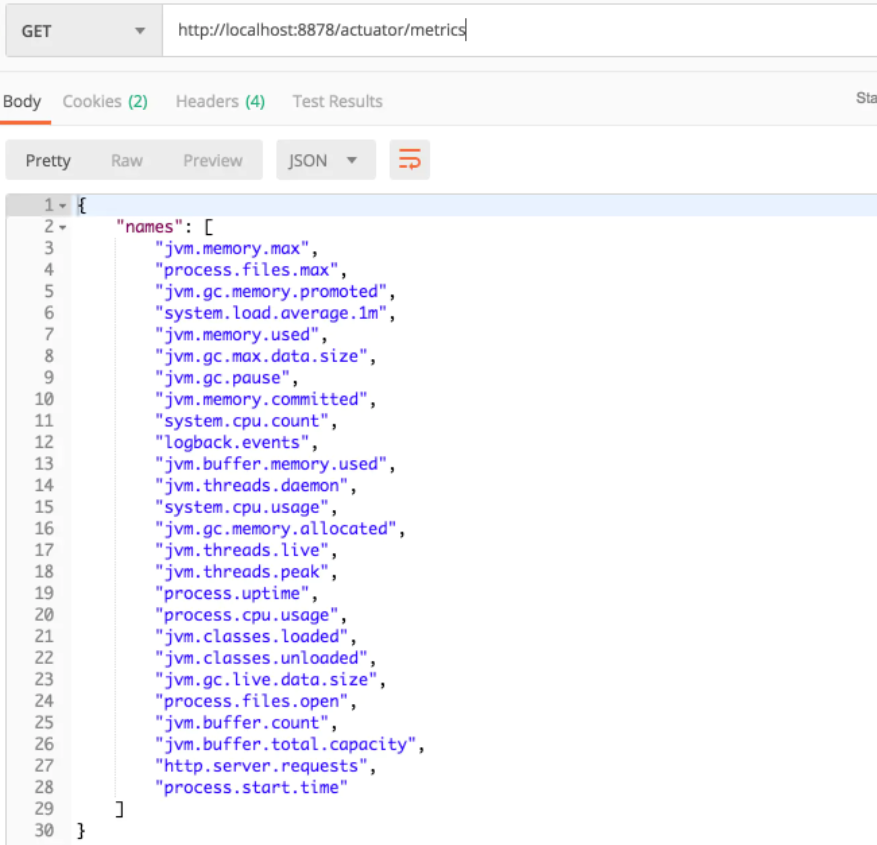
如果想要查看单个度量的详细信息,我们需要度量名称传入到metrics request接口中,如下所示:
http://localhost:8080/actuator/metrics/{MetricName}
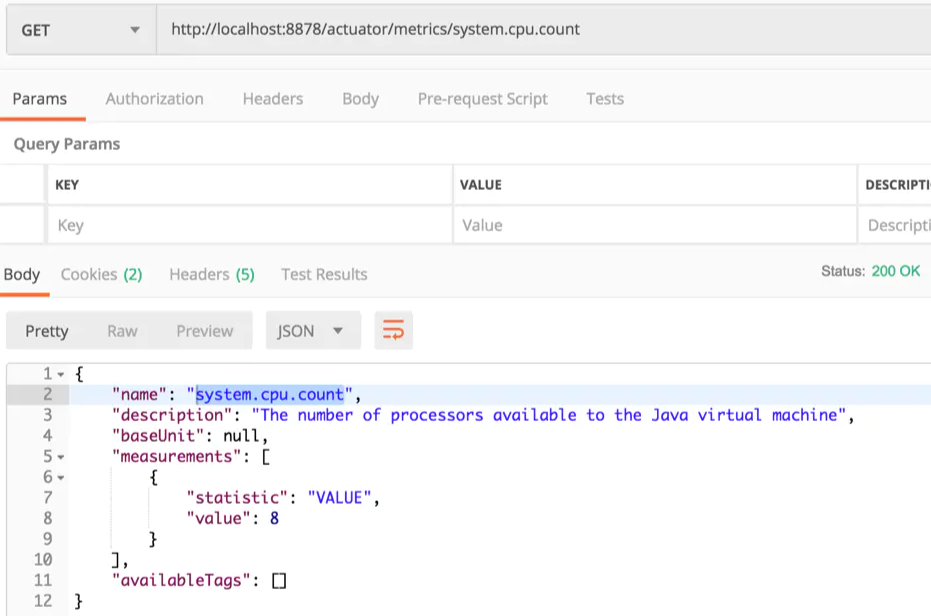
例如我们想要查看system.cpu.count 度量,如下进行访问:
# 2、loggers
loggers endpoint 展示了应用中可配置的loggers列表和相关日志等级。
通过访问接口http://localhost:8080/actuator/loggers
如果我们想要查看单个logger的日志配置信息,可以访问如下格式的:
http://localhost:8080/actuator/loggers/{name}
# 3、httptrace
httptrace endpoint 显示HTTP足迹,可以看到最近浏览的网页记录。
通过访问http://localhost:8081/httptrace (opens new window)
# 2.2 endpoint配置
# 1、需要暴露的endpoint
include表示需要暴露的endpoint。
# 暴露所有端点
management.endpoints.web.exposure.include=*

# 或者指定具体端点
management.endpoints.web.exposure.include=health,info
2
3
4
5
- 通过配置include: "*",除了shutdown endpoint,所有的endpints都是打开的。
- 配置指定具体端点时使用“,”隔开。
# 2、排除暴露endpoint
exclude表示在暴露endpoint时,排除掉哪些。
management.endpoints.web.exposure.exclude=health,info
# 3、控制单个endpoint
如果我们想要控制单个endpoint 开关,可以进行如下配置:
management.endpoint.<id>.enabled=true/false
例如,想要打开shutdown endpint,可以在application.properties文件中进行如下配置:
management.endpoint.shutdown.enabled=true
# 三、Actuator使用
Maven引入依赖
<dependency>
    <groupId>org.springframework.boot</groupId>
    <artifactId>spring-boot-starter-actuator</artifactId>
</dependency>
2
3
4
在应用启动之后,访问http://localhost:8080/actuator。
- /actuator:接口展示,显示actuator提供的访问接口,显示的是3个,不过这只是默认显示,我们可以进行配置管理。
- /actuator/health:健康检查,显示应用健康信息。
- /actuator/info:应用信息,展示了关于应用的一般信息,这些信息从编译文件比如META-INF/build-info.properties或者Git文件比如git.properties或者任何环境的property中获取。
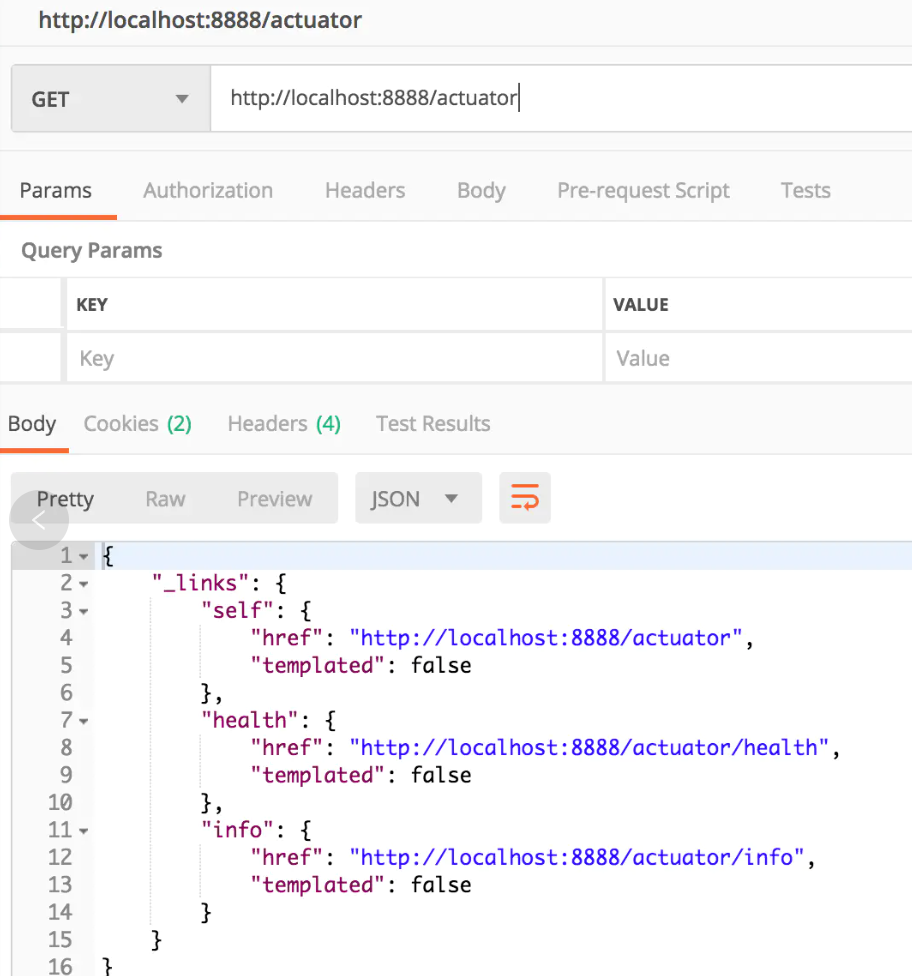
默认情况下,只有 health 和 info 这2个endpoint,通过 HTTP 暴露出来。所以 /actuator 只展示了 health 和 info endpoints。
如何暴露其他的 endpoints ,在application.yml文件配置如下:
server:
  port: 8080 #web服务端口

#actuator
management:
  endpoints:
    web:
      base-path: /
      exposure:
        include: "*"
2
3
4
5
6
7
8
9
10